yasc.scorecard.rocplot
-
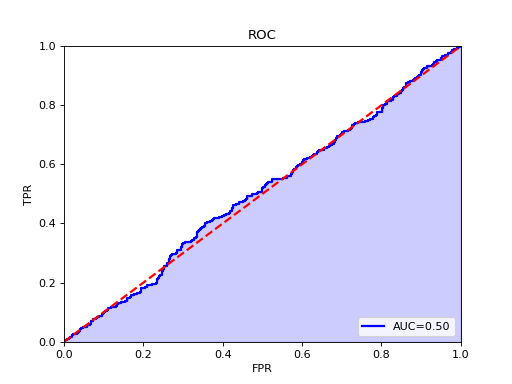
yasc.scorecard.rocplot(y_true, y_preds, equal_aspect=False)¶ Plot a ROC curve.
- Parameters
- y_truearray, shape=[n_samples]
True binary labels.
- y_predsarray, shape=[n_samples]
Predicted probability estimates of the positive class.
- equal_aspectbool, optional
Whether to make the aspect equal. Defaults to
False.
- Returns
- roc_aucfloat
Returns area under the curve.
- axmatplotlib.axes.Axes
Returns axes object with the plot drawn onto it.
Examples
>>> from yasc.scorecard.util import rocplot
>>> import numpy as np
>>> np.random.seed(0)
>>> preds = np.random.rand(1000)
>>> labels = np.random.choice(2, 1000)
>>> rocplot(labels, preds)